Linux死锁现象及分析方法(转)
本节我们对Linux死锁做一个基本的介绍,然后讲解如何检测并定位死锁。
1. 什么是死锁?
死锁(DeadLock)是指两个或者两个以上的进程(线程)在执行过程中,因争夺资源而造成的一种互相等待的现象,若无外力作用,它们都将无法推进下去。此时称系统处于死锁状态或系统产生了死锁,这些永远在互相等待的进程(线程)称为死锁进程(线程)。由于资源占用是互斥的,当某个进程提出申请后,使得有关进程(线程)在无外力协助下,永远分配不到必需的资源而无法继续进行,这就产生了一种特殊现象——死锁。
一种交叉持锁死锁的情形,此时执行程序中两个或多个线程发生永久堵塞(等待),每个线程都在等待被其他线程占用并堵塞了的资源。例如,如果线程1锁住了记录A并等待记录B,而线程2锁住了记录B并等待记录A,这样两个线程就发生了死锁现象。在计算机系统中,如果系统的资源分配策略不当,更常见的可能是程序员写的程序有错误等,则会导致进程因竞争资源不当而产生死锁的现象。
2. 产生死锁的四个必要条件
1) 对临界资源的互斥使用(资源独占)
一个资源每次只能给一个进程(线程)使用。比如写操作
2) 占有且等待
进程在申请新的资源的同时,保持对原有资源的占有。
3) 不可抢占
资源申请者不能强行从资源占有者手中夺取资源,资源只能由占有者自愿释放。
4) 循环等待
P1等待P2占有的资源,P2等待P3占有的资源, … Pn等待P1占有的资源,形成一个进程等待回路。
3. 一个例子及图示
3.1 图示
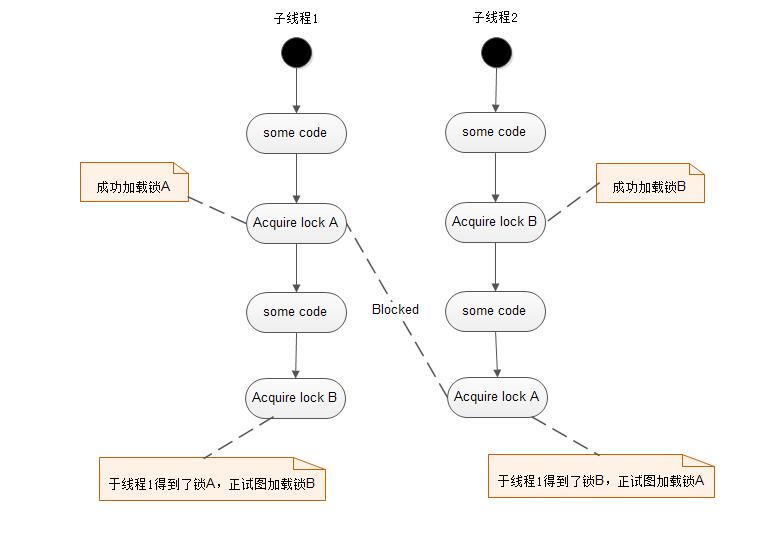
进程在执行一些代码之后,子线程1获得了锁A,正试图获得锁B;子线程2此时获得锁B,正试图获得锁A,这样子线程1和子线程2将没办法同时获得锁A和锁B,因为它们各自被对方占有,永远不会释放,从而发生死锁现象。
3.2 示例代码
参看如下示例代码(deadlock.c):
#include <unistd.h>
#include <pthread.h>
#include <string.h>

pthread_mutex_t mutexA = PTHREAD_MUTEX_INITIALIZER;
pthread_mutex_t mutexB = PTHREAD_MUTEX_INITIALIZER;
pthread_mutex_t mutexC = PTHREAD_MUTEX_INITIALIZER;


static int counterA = 0;
static int counterB = 0;

int func1()
{
	pthread_mutex_lock(&mutexA);
	++counterA;
	sleep(1);
	pthread_mutex_lock(&mutexB);
	++counterB;
	pthread_mutex_unlock(&mutexB);
	pthread_mutex_unlock(&mutexA);

	return counterA;
}

int func2()
{
	pthread_mutex_lock(&mutexB);
	++counterB;
	sleep(1);
	pthread_mutex_lock(&mutexA);
	++counterA;
	pthread_mutex_unlock(&mutexA);
	pthread_mutex_unlock(&mutexB);

	return counterB;
}

void* start_routine1(void* arg)
{
	while (1)
	{
		int iRetValue = func1();

		if (iRetValue == 100000)
		{
			pthread_exit(NULL);
		}
	}
}

void* start_routine2(void* arg)
{
	while (1)
	{
		int iRetValue = func2();

		if (iRetValue == 100000)
		{
			pthread_exit(NULL);
		}
	}
}

void* start_routine(void* arg)
{
	while (1)
	{
		sleep(1);
		char szBuf[128];
		memset(szBuf, 0, sizeof(szBuf));
		strcpy(szBuf, (char*)arg);
	}
}

int main()
{
	pthread_t tid[4];
	if (pthread_create(&tid[0], NULL, &start_routine1, NULL) != 0)
	{
		_exit(1);
	}
	if (pthread_create(&tid[1], NULL, &start_routine2, NULL) != 0)
	{
		_exit(1);
	}
	if (pthread_create(&tid[2], NULL, &start_routine, "thread3") != 0)
	{
		_exit(1);
	}
	if (pthread_create(&tid[3], NULL, &start_routine, "thread3") != 0)
	{
		_exit(1);
	}

	sleep(5);
	//pthread_cancel(tid[0]);

	pthread_join(tid[0], NULL);
	pthread_join(tid[1], NULL);
	pthread_join(tid[2], NULL);
	pthread_join(tid[3], NULL);

	pthread_mutex_destroy(&mutexA);
	pthread_mutex_destroy(&mutexB);
	pthread_mutex_destroy(&mutexC);


	return 0;
}
3.3 编译程序并执行
执行如下命令编译程序并执行:
# gcc -g -o deadlock deadlock.c -lpthread
# ./deadlock

# ps -ef | grep deadlock
root     20495  6820  0 13:50 pts/0    00:00:00 ./deadlock
4. 使用pstack和gdb工具对死锁程序进行分析
4.1 pstack
pstack命令可显示每个进程的栈跟踪,pstack $pid即可,pstack命令须由$pid进程的属主或者root运行。下面第一次执行:
# pstack 20495
Thread 5 (Thread 0x7f0d2359f700 (LWP 20496)):
#0  0x00007f0d2396f1bd in __lll_lock_wait () from /lib64/libpthread.so.0
#1  0x00007f0d2396ad02 in _L_lock_791 () from /lib64/libpthread.so.0
#2  0x00007f0d2396ac08 in pthread_mutex_lock () from /lib64/libpthread.so.0
#3  0x0000000000400917 in func1 () at deadlock.c:18
#4  0x00000000004009b4 in start_routine1 (arg=0x0) at deadlock.c:43
#5  0x00007f0d23968dc5 in start_thread () from /lib64/libpthread.so.0
#6  0x00007f0d2369776d in clone () from /lib64/libc.so.6
Thread 4 (Thread 0x7f0d22d9e700 (LWP 20497)):
#0  0x00007f0d2396f1bd in __lll_lock_wait () from /lib64/libpthread.so.0
#1  0x00007f0d2396ad02 in _L_lock_791 () from /lib64/libpthread.so.0
#2  0x00007f0d2396ac08 in pthread_mutex_lock () from /lib64/libpthread.so.0
#3  0x0000000000400973 in func2 () at deadlock.c:31
#4  0x00000000004009e2 in start_routine2 (arg=0x0) at deadlock.c:56
#5  0x00007f0d23968dc5 in start_thread () from /lib64/libpthread.so.0
#6  0x00007f0d2369776d in clone () from /lib64/libc.so.6
Thread 3 (Thread 0x7f0d2259d700 (LWP 20498)):
#0  0x00007f0d2365e66d in nanosleep () from /lib64/libc.so.6
#1  0x00007f0d2365e504 in sleep () from /lib64/libc.so.6
#2  0x0000000000400a16 in start_routine (arg=0x400bf4) at deadlock.c:69
#3  0x00007f0d23968dc5 in start_thread () from /lib64/libpthread.so.0
#4  0x00007f0d2369776d in clone () from /lib64/libc.so.6
Thread 2 (Thread 0x7f0d21d9c700 (LWP 20499)):
#0  0x00007f0d2365e66d in nanosleep () from /lib64/libc.so.6
#1  0x00007f0d2365e504 in sleep () from /lib64/libc.so.6
#2  0x0000000000400a16 in start_routine (arg=0x400bf4) at deadlock.c:69
#3  0x00007f0d23968dc5 in start_thread () from /lib64/libpthread.so.0
#4  0x00007f0d2369776d in clone () from /lib64/libc.so.6
Thread 1 (Thread 0x7f0d23d80740 (LWP 20495)):
#0  0x00007f0d23969ef7 in pthread_join () from /lib64/libpthread.so.0
#1  0x0000000000400b17 in main () at deadlock.c:99
第二次执行:
# pstack 20495
Thread 5 (Thread 0x7f0d2359f700 (LWP 20496)):
#0  0x00007f0d2396f1bd in __lll_lock_wait () from /lib64/libpthread.so.0
#1  0x00007f0d2396ad02 in _L_lock_791 () from /lib64/libpthread.so.0
#2  0x00007f0d2396ac08 in pthread_mutex_lock () from /lib64/libpthread.so.0
#3  0x0000000000400917 in func1 () at deadlock.c:18
#4  0x00000000004009b4 in start_routine1 (arg=0x0) at deadlock.c:43
#5  0x00007f0d23968dc5 in start_thread () from /lib64/libpthread.so.0
#6  0x00007f0d2369776d in clone () from /lib64/libc.so.6
Thread 4 (Thread 0x7f0d22d9e700 (LWP 20497)):
#0  0x00007f0d2396f1bd in __lll_lock_wait () from /lib64/libpthread.so.0
#1  0x00007f0d2396ad02 in _L_lock_791 () from /lib64/libpthread.so.0
#2  0x00007f0d2396ac08 in pthread_mutex_lock () from /lib64/libpthread.so.0
#3  0x0000000000400973 in func2 () at deadlock.c:31
#4  0x00000000004009e2 in start_routine2 (arg=0x0) at deadlock.c:56
#5  0x00007f0d23968dc5 in start_thread () from /lib64/libpthread.so.0
#6  0x00007f0d2369776d in clone () from /lib64/libc.so.6
Thread 3 (Thread 0x7f0d2259d700 (LWP 20498)):
#0  0x00007f0d2365e66d in nanosleep () from /lib64/libc.so.6
#1  0x00007f0d2365e504 in sleep () from /lib64/libc.so.6
#2  0x0000000000400a16 in start_routine (arg=0x400bf4) at deadlock.c:69
#3  0x00007f0d23968dc5 in start_thread () from /lib64/libpthread.so.0
#4  0x00007f0d2369776d in clone () from /lib64/libc.so.6
Thread 2 (Thread 0x7f0d21d9c700 (LWP 20499)):
#0  0x00007f0d2365e66d in nanosleep () from /lib64/libc.so.6
#1  0x00007f0d2365e504 in sleep () from /lib64/libc.so.6
#2  0x0000000000400a16 in start_routine (arg=0x400bf4) at deadlock.c:69
#3  0x00007f0d23968dc5 in start_thread () from /lib64/libpthread.so.0
#4  0x00007f0d2369776d in clone () from /lib64/libc.so.6
Thread 1 (Thread 0x7f0d23d80740 (LWP 20495)):
#0  0x00007f0d23969ef7 in pthread_join () from /lib64/libpthread.so.0
#1  0x0000000000400b17 in main () at deadlock.c:99
连续多次查看这个进程的函数调用关系堆栈,死锁线程将一直处于等锁状态,对比多次的函数调用堆栈输出结果,确定哪两个线程(或者几个线程)一直没有变化且一直处于等锁的状态。
分析:
根据上面的输出对比,线程1和线程2的pstack输出表明其正处于sleep状态,没有问题。但是线程4和线程5一直处在等锁状态(pthread_mutex_lock),在连续两次的pstack信息输出中没有发生变化,所以我们可以推测线程4和线程5发生了死锁。
然后,我们通过gdb attach到死锁进程:
# gdb attach 20495
GNU gdb (GDB) Red Hat Enterprise Linux 7.6.1-94.el7
Copyright (C) 2013 Free Software Foundation, Inc.
License GPLv3+: GNU GPL version 3 or later <http://gnu.org/licenses/gpl.html>
This is free software: you are free to change and redistribute it.
There is NO WARRANTY, to the extent permitted by law.  Type "show copying"
and "show warranty" for details.
This GDB was configured as "x86_64-redhat-linux-gnu".
For bug reporting instructions, please see:
<http://www.gnu.org/software/gdb/bugs/>...
attach: 没有那个文件或目录.
Attaching to process 20495
Reading symbols from /data/home/lzy/just_for_test/deadlock...done.
Reading symbols from /lib64/libpthread.so.0...(no debugging symbols found)...done.
[New LWP 20499]
[New LWP 20498]
[New LWP 20497]
[New LWP 20496]
[Thread debugging using libthread_db enabled]
Using host libthread_db library "/lib64/libthread_db.so.1".
Loaded symbols for /lib64/libpthread.so.0
Reading symbols from /lib64/libc.so.6...(no debugging symbols found)...done.
Loaded symbols for /lib64/libc.so.6
Reading symbols from /lib64/ld-linux-x86-64.so.2...(no debugging symbols found)...done.
Loaded symbols for /lib64/ld-linux-x86-64.so.2
0x00007f0d23969ef7 in pthread_join () from /lib64/libpthread.so.0
Missing separate debuginfos, use: debuginfo-install glibc-2.17-157.el7_3.2.x86_64
(gdb) info thread
  Id   Target Id         Frame
  5    Thread 0x7f0d2359f700 (LWP 20496) "deadlock" 0x00007f0d2396f1bd in __lll_lock_wait () from /lib64/libpthread.so.0
  4    Thread 0x7f0d22d9e700 (LWP 20497) "deadlock" 0x00007f0d2396f1bd in __lll_lock_wait () from /lib64/libpthread.so.0
  3    Thread 0x7f0d2259d700 (LWP 20498) "deadlock" 0x00007f0d2365e66d in nanosleep () from /lib64/libc.so.6
  2    Thread 0x7f0d21d9c700 (LWP 20499) "deadlock" 0x00007f0d2365e66d in nanosleep () from /lib64/libc.so.6
* 1 Thread 0x7f0d23d80740 (LWP 20495) "deadlock" 0x00007f0d23969ef7 in pthread_join () from /lib64/libpthread.so.0查看线程4和线程5的输出:
(gdb) thread 5
[Switching to thread 5 (Thread 0x7f0d2359f700 (LWP 20496))]
#0  0x00007f0d2396f1bd in __lll_lock_wait () from /lib64/libpthread.so.0
(gdb) where
#0  0x00007f0d2396f1bd in __lll_lock_wait () from /lib64/libpthread.so.0
#1  0x00007f0d2396ad02 in _L_lock_791 () from /lib64/libpthread.so.0
#2  0x00007f0d2396ac08 in pthread_mutex_lock () from /lib64/libpthread.so.0
#3  0x0000000000400917 in func1 () at deadlock.c:18
#4  0x00000000004009b4 in start_routine1 (arg=0x0) at deadlock.c:43
#5  0x00007f0d23968dc5 in start_thread () from /lib64/libpthread.so.0
#6  0x00007f0d2369776d in clone () from /lib64/libc.so.6
(gdb) frame 3
#3  0x0000000000400917 in func1 () at deadlock.c:18
18              pthread_mutex_lock(&mutexB);
(gdb) thread 4
[Switching to thread 4 (Thread 0x7f0d22d9e700 (LWP 20497))]
#0  0x00007f0d2396f1bd in __lll_lock_wait () from /lib64/libpthread.so.0
(gdb) where
#0  0x00007f0d2396f1bd in __lll_lock_wait () from /lib64/libpthread.so.0
#1  0x00007f0d2396ad02 in _L_lock_791 () from /lib64/libpthread.so.0
#2  0x00007f0d2396ac08 in pthread_mutex_lock () from /lib64/libpthread.so.0
#3  0x0000000000400973 in func2 () at deadlock.c:31
#4  0x00000000004009e2 in start_routine2 (arg=0x0) at deadlock.c:56
#5  0x00007f0d23968dc5 in start_thread () from /lib64/libpthread.so.0
#6  0x00007f0d2369776d in clone () from /lib64/libc.so.6
(gdb) frame 3
#3  0x0000000000400973 in func2 () at deadlock.c:31
31              pthread_mutex_lock(&mutexA);
(gdb) p mutexA
$1 = {__data = {__lock = 2, __count = 0, __owner = 20496, __nusers = 1, __kind = 0, __spins = 0, __list = {__prev = 0x0, __next = 0x0}},
  __size = "\002\000\000\000\000\000\000\000\020P\000\000\001", '\000' <repeats 26 times>, __align = 2}
(gdb) p mutexB
$2 = {__data = {__lock = 2, __count = 0, __owner = 20497, __nusers = 1, __kind = 0, __spins = 0, __list = {__prev = 0x0, __next = 0x0}},
  __size = "\002\000\000\000\000\000\000\000\021P\000\000\001", '\000' <repeats 26 times>, __align = 2}
(gdb)从上面可以发现,线程4正试图获得锁mutexA,但是锁mutexA已经被LWP为20496的线程得到(__owner=20496),线程5正试图获得锁mutextB,但是锁mutexB已经被LWP为20497的线程得到(__owner=20497),从pstack的输出可以发现LWP 20496与线程5对应,LWP 20496与线程4对应。所以我们可以得出,线程4和线程5发生了交叉持锁的现象。查看线程的源代码发现,线程4和线程5同时使用mutexA和mutexB,且申请顺序不合理。
5. 利用core文件分析
运行./deadlock(编译的时候加调试选项-g):
# ulimit -c
0
# ulimit -c unlimited
# ulimit -c
unlimited
# ./deadlock

# ps -ef | grep deadlock
root     30811  6820  0 14:32 pts/0    00:00:00 ./deadlock
[root@compile just_for_test]# pstack 30811
Thread 5 (Thread 0x7f14b4c78700 (LWP 30812)):
#0  0x00007f14b50481bd in __lll_lock_wait () from /lib64/libpthread.so.0
#1  0x00007f14b5043d02 in _L_lock_791 () from /lib64/libpthread.so.0
#2  0x00007f14b5043c08 in pthread_mutex_lock () from /lib64/libpthread.so.0
#3  0x0000000000400917 in func1 () at deadlock.c:18
#4  0x00000000004009b4 in start_routine1 (arg=0x0) at deadlock.c:43
#5  0x00007f14b5041dc5 in start_thread () from /lib64/libpthread.so.0
#6  0x00007f14b4d7076d in clone () from /lib64/libc.so.6
Thread 4 (Thread 0x7f14b4477700 (LWP 30813)):
#0  0x00007f14b50481bd in __lll_lock_wait () from /lib64/libpthread.so.0
#1  0x00007f14b5043d02 in _L_lock_791 () from /lib64/libpthread.so.0
#2  0x00007f14b5043c08 in pthread_mutex_lock () from /lib64/libpthread.so.0
#3  0x0000000000400973 in func2 () at deadlock.c:31
#4  0x00000000004009e2 in start_routine2 (arg=0x0) at deadlock.c:56
#5  0x00007f14b5041dc5 in start_thread () from /lib64/libpthread.so.0
#6  0x00007f14b4d7076d in clone () from /lib64/libc.so.6
Thread 3 (Thread 0x7f14b3c76700 (LWP 30814)):
#0  0x00007f14b4d3766d in nanosleep () from /lib64/libc.so.6
#1  0x00007f14b4d37504 in sleep () from /lib64/libc.so.6
#2  0x0000000000400a16 in start_routine (arg=0x400bf4) at deadlock.c:69
#3  0x00007f14b5041dc5 in start_thread () from /lib64/libpthread.so.0
#4  0x00007f14b4d7076d in clone () from /lib64/libc.so.6
Thread 2 (Thread 0x7f14b3475700 (LWP 30815)):
#0  0x00007f14b4d3766d in nanosleep () from /lib64/libc.so.6
#1  0x00007f14b4d37504 in sleep () from /lib64/libc.so.6
#2  0x0000000000400a16 in start_routine (arg=0x400bf4) at deadlock.c:69
#3  0x00007f14b5041dc5 in start_thread () from /lib64/libpthread.so.0
#4  0x00007f14b4d7076d in clone () from /lib64/libc.so.6
Thread 1 (Thread 0x7f14b5459740 (LWP 30811)):
#0  0x00007f14b5042ef7 in pthread_join () from /lib64/libpthread.so.0
#1  0x0000000000400b17 in main () at deadlock.c:99
按CTRL+\产生coredump:
# ls
core.30811  deadlock  deadlock.c
然后再用gdb来调试该coredump文件:
# gdb ./deadlock core.30811
GNU gdb (GDB) Red Hat Enterprise Linux 7.6.1-94.el7
Copyright (C) 2013 Free Software Foundation, Inc.
License GPLv3+: GNU GPL version 3 or later <http://gnu.org/licenses/gpl.html>
This is free software: you are free to change and redistribute it.
There is NO WARRANTY, to the extent permitted by law.  Type "show copying"
and "show warranty" for details.
This GDB was configured as "x86_64-redhat-linux-gnu".
For bug reporting instructions, please see:
<http://www.gnu.org/software/gdb/bugs/>...
Reading symbols from /data/home/lzy/just_for_test/deadlock...done.
[New LWP 30811]
[New LWP 30814]
[New LWP 30813]
[New LWP 30812]
[New LWP 30815]
[Thread debugging using libthread_db enabled]
Using host libthread_db library "/lib64/libthread_db.so.1".
Core was generated by `./deadlock'.
Program terminated with signal 3, Quit.
#0  0x00007f14b5042ef7 in pthread_join () from /lib64/libpthread.so.0
Missing separate debuginfos, use: debuginfo-install glibc-2.17-157.el7_3.2.x86_64
(gdb)
(gdb)
(gdb) thread apply all bt

Thread 5 (Thread 0x7f14b3475700 (LWP 30815)):
#0  0x00007f14b4d3766d in nanosleep () from /lib64/libc.so.6
#1  0x00007f14b4d37504 in sleep () from /lib64/libc.so.6
#2  0x0000000000400a16 in start_routine (arg=0x400bf4) at deadlock.c:69
#3  0x00007f14b5041dc5 in start_thread () from /lib64/libpthread.so.0
#4  0x00007f14b4d7076d in clone () from /lib64/libc.so.6

Thread 4 (Thread 0x7f14b4c78700 (LWP 30812)):
#0  0x00007f14b50481bd in __lll_lock_wait () from /lib64/libpthread.so.0
#1  0x00007f14b5043d02 in _L_lock_791 () from /lib64/libpthread.so.0
#2  0x00007f14b5043c08 in pthread_mutex_lock () from /lib64/libpthread.so.0
#3  0x0000000000400917 in func1 () at deadlock.c:18
#4  0x00000000004009b4 in start_routine1 (arg=0x0) at deadlock.c:43
#5  0x00007f14b5041dc5 in start_thread () from /lib64/libpthread.so.0
#6  0x00007f14b4d7076d in clone () from /lib64/libc.so.6

Thread 3 (Thread 0x7f14b4477700 (LWP 30813)):
#0  0x00007f14b50481bd in __lll_lock_wait () from /lib64/libpthread.so.0
#1  0x00007f14b5043d02 in _L_lock_791 () from /lib64/libpthread.so.0
#2  0x00007f14b5043c08 in pthread_mutex_lock () from /lib64/libpthread.so.0
#3  0x0000000000400973 in func2 () at deadlock.c:31
#4  0x00000000004009e2 in start_routine2 (arg=0x0) at deadlock.c:56
#5  0x00007f14b5041dc5 in start_thread () from /lib64/libpthread.so.0
#6  0x00007f14b4d7076d in clone () from /lib64/libc.so.6

Thread 2 (Thread 0x7f14b3c76700 (LWP 30814)):
#0  0x00007f14b4d3766d in nanosleep () from /lib64/libc.so.6
#1  0x00007f14b4d37504 in sleep () from /lib64/libc.so.6
#2  0x0000000000400a16 in start_routine (arg=0x400bf4) at deadlock.c:69
#3  0x00007f14b5041dc5 in start_thread () from /lib64/libpthread.so.0
#4  0x00007f14b4d7076d in clone () from /lib64/libc.so.6

Thread 1 (Thread 0x7f14b5459740 (LWP 30811)):
#0  0x00007f14b5042ef7 in pthread_join () from /lib64/libpthread.so.0
#1  0x0000000000400b17 in main () at deadlock.c:99
(gdb)
从上面我们也可以看到相应的死锁方面的信息。
6. 利用valgrind(DRD+Helgrind)来分析死锁
下面我们将介绍如何使用valgrind来排查死锁问题(说明: 这里DRD是Data Race Detection的缩写)。我们先构造一个死锁场景(dead_lock.c):
#include <pthread.h>

pthread_mutex_t s_mutex_a;
pthread_mutex_t s_mutex_b;
pthread_barrier_t s_barrier;

void lock() {
    pthread_mutex_lock(&s_mutex_b);
    {
        pthread_barrier_wait(&s_barrier);			//10行

        pthread_mutex_lock(&s_mutex_a);
        pthread_mutex_unlock(&s_mutex_a);
    }
    pthread_mutex_unlock(&s_mutex_b);
}

static void* thread_routine(void* arg) {
    pthread_mutex_lock(&s_mutex_a);
    {
        pthread_barrier_wait(&s_barrier);		//21行

        pthread_mutex_lock(&s_mutex_b);
        pthread_mutex_unlock(&s_mutex_b);
    }
    pthread_mutex_unlock(&s_mutex_a);
}

int main(int argc, char** argv) {
    pthread_t tid;

    pthread_mutex_init(&s_mutex_a, 0);
    pthread_mutex_init(&s_mutex_b, 0);
    pthread_barrier_init(&s_barrier, 0, 2);

    pthread_create(&tid, 0, &thread_routine, 0);

    lock();

    pthread_join(tid, 0);
    pthread_cancel(tid);

    pthread_barrier_destroy(&s_barrier);
    pthread_mutex_destroy(&s_mutex_a);
    pthread_mutex_destroy(&s_mutex_b);

    return 0;
}上面这段代码我们只要关注lock和thread_routine两个方法。lock()方法在主线程中执行,它先给s_mutex_b上锁,然后通过屏障s_barrier等待线程也执行到屏障处(第21行);thread_routine()是线程函数,它先给s_mutex_a上锁,然后通过屏障s_barrier等待
主线程也执行到屏障处(第10行)。
主线程和子线程都执行到屏障处后,屏障被打开,它们继续向下执行: 主线程执行到第12行试图获取s_mutex_a;子线程执行到第23行试图获取s_mutex_b。由于这两个互斥量已经被占用,所以产生死锁。
这是通过代码分析出来的,但是对于比较大的工程项目,我们则需要通过工具来分析。下面我们使用valgrind来分析:
# gcc -g -o dead_lock dead_lock.c -lpthread
# valgrind --tool=drd --trace-mutex=yes ./dead_lock
==9373== drd, a thread error detector
==9373== Copyright (C) 2006-2015, and GNU GPL'd, by Bart Van Assche.
==9373== Using Valgrind-3.11.0 and LibVEX; rerun with -h for copyright info
==9373== Command: ./dead_lock
==9373==
==9373== [1] mutex_init      mutex 0x6010c0
==9373== [1] mutex_init      mutex 0x601120
==9373== [1] mutex_init      mutex 0xffeffff10
==9373== [1] mutex_ignore_ordering mutex 0xffeffff10
==9373== [1] mutex_trylock   mutex 0xffeffff10 rc 0 owner 0
==9373== [1] post_mutex_lock mutex 0xffeffff10 rc 0 owner 0
==9373== [1] mutex_unlock    mutex 0xffeffff10 rc 1
==9373== [2] mutex_trylock   mutex 0xffeffff10 rc 0 owner 1
==9373== [2] post_mutex_lock mutex 0xffeffff10 rc 0 owner 1
==9373== [2] mutex_unlock    mutex 0xffeffff10 rc 1
==9373== [2] mutex_trylock   mutex 0x6010c0 rc 0 owner 0
==9373== [2] post_mutex_lock mutex 0x6010c0 rc 0 owner 0
==9373== [1] mutex_trylock   mutex 0xffeffff10 rc 0 owner 2
==9373== [1] post_mutex_lock mutex 0xffeffff10 rc 0 owner 2
==9373== [1] mutex_unlock    mutex 0xffeffff10 rc 1
==9373== [1] mutex_destroy   mutex 0xffeffff10 rc 0 owner 1
==9373== [1] mutex_trylock   mutex 0x601120 rc 0 owner 0
==9373== [1] post_mutex_lock mutex 0x601120 rc 0 owner 0
==9373== [1] mutex_trylock   mutex 0x6010c0 rc 1 owner 2			//18行
==9373== [2] mutex_trylock   mutex 0x601120 rc 1 owner 1			//19行
通过使用上面的指令,让valgrind把互斥量相关的信息打印出来了。
第18行显示线程1试图给0x6010c0互斥量上锁,但是该互斥量的所有者(owner)是线程2;
第19行显示线程2试图该0x601120互斥量上锁,但是该互斥量的所有者(owner)是线程1;
如此,我们便可以确定这段程序卡住是因为死锁导致的。但是DRD有个问题,不能指出发生死锁的位置。这个时候Helgrind就该出场了:
# valgrind --tool=helgrind ./dead_lock
==14606== Helgrind, a thread error detector
==14606== Copyright (C) 2007-2015, and GNU GPL'd, by OpenWorks LLP et al.
==14606== Using Valgrind-3.11.0 and LibVEX; rerun with -h for copyright info
==14606== Command: ./dead_lock
==14606==
helgrind执行时,如果发生死锁,需要ctrl+c来终止运行,于是可以得到如下结果:
^C==14606==
==14606== Process terminating with default action of signal 2 (SIGINT)
==14606==    at 0x4E471BD: __lll_lock_wait (in /usr/lib64/libpthread-2.17.so)
==14606==    by 0x4E42D01: _L_lock_791 (in /usr/lib64/libpthread-2.17.so)
==14606==    by 0x4E42C06: pthread_mutex_lock (in /usr/lib64/libpthread-2.17.so)
==14606==    by 0x4C2BC4B: mutex_lock_WRK (hg_intercepts.c:894)
==14606==    by 0x4C2FB0D: pthread_mutex_lock (hg_intercepts.c:917)
==14606==    by 0x400947: lock (dead_lock.c:12)
==14606==    by 0x400A03: main (dead_lock.c:38)
==14606== ---Thread-Announcement------------------------------------------
==14606==
==14606== Thread #1 is the program's root thread
==14606==
==14606== ----------------------------------------------------------------
==14606==
==14606== Thread #1: Exiting thread still holds 1 lock
==14606==    at 0x4E471BD: __lll_lock_wait (in /usr/lib64/libpthread-2.17.so)
==14606==    by 0x4E42D01: _L_lock_791 (in /usr/lib64/libpthread-2.17.so)
==14606==    by 0x4E42C06: pthread_mutex_lock (in /usr/lib64/libpthread-2.17.so)
==14606==    by 0x4C2BC4B: mutex_lock_WRK (hg_intercepts.c:894)
==14606==    by 0x4C2FB0D: pthread_mutex_lock (hg_intercepts.c:917)
==14606==    by 0x400947: lock (dead_lock.c:12)						//22行
==14606==    by 0x400A03: main (dead_lock.c:38)
==14606==
==14606== ---Thread-Announcement------------------------------------------
==14606==
==14606== Thread #2 was created
==14606==    at 0x514C72E: clone (in /usr/lib64/libc-2.17.so)
==14606==    by 0x4E3FF79: do_clone.constprop.4 (in /usr/lib64/libpthread-2.17.so)
==14606==    by 0x4E41468: pthread_create@@GLIBC_2.2.5 (in /usr/lib64/libpthread-2.17.so)
==14606==    by 0x4C2E64A: pthread_create_WRK (hg_intercepts.c:427)
==14606==    by 0x4C2F728: pthread_create@* (hg_intercepts.c:460)
==14606==    by 0x4009F9: main (dead_lock.c:36)
==14606==
==14606== ----------------------------------------------------------------
==14606==
==14606== Thread #2: Exiting thread still holds 1 lock
==14606==    at 0x4E471BD: __lll_lock_wait (in /usr/lib64/libpthread-2.17.so)
==14606==    by 0x4E42D01: _L_lock_791 (in /usr/lib64/libpthread-2.17.so)
==14606==    by 0x4E42C06: pthread_mutex_lock (in /usr/lib64/libpthread-2.17.so)
==14606==    by 0x4C2BC4B: mutex_lock_WRK (hg_intercepts.c:894)
==14606==    by 0x4C2FB0D: pthread_mutex_lock (hg_intercepts.c:917)
==14606==    by 0x400987: thread_routine (dead_lock.c:23)					//43行
==14606==    by 0x4C2E83E: mythread_wrapper (hg_intercepts.c:389)
==14606==    by 0x4E40DC4: start_thread (in /usr/lib64/libpthread-2.17.so)
==14606==    by 0x514C76C: clone (in /usr/lib64/libc-2.17.so)
==14606==
==14606==
==14606== For counts of detected and suppressed errors, rerun with: -v
==14606== Use --history-level=approx or =none to gain increased speed, at
==14606== the cost of reduced accuracy of conflicting-access information
==14606== ERROR SUMMARY: 2 errors from 2 contexts (suppressed: 2 from 2)
已杀死
第22行和第43行分别显示了主线程和子线程在中断之前,都锁在哪一行。这样就更容易定位问题了。
[参看]
